Most DeFi borrowers make rate decisions the wrong way. They open the app, see a number — say, 8% on Aave for USDC — and compare it to whatever they remember seeing before. If it looks reasonable, they borrow. If it looks high, they wait. Neither approach answers the question that actually matters: is 8% historically high, low, or ordinary for this asset on this protocol?
Without historical context, a rate is not information. It is just a number, and treating it as a complete picture is how borrowers end up entering positions at the worst possible moment without realizing it. SmartCredit.io’s Compare Historical Rates tool fills that gap, showing how borrowing rates have moved across the major DeFi protocols over time — from one week to five years — so borrowers can decide with the data they actually need.
Key Takeaways
- DeFi lending protocols show you today’s rate but almost never the history behind it — Compare Historical Rates plots up to five years of data across six protocols.
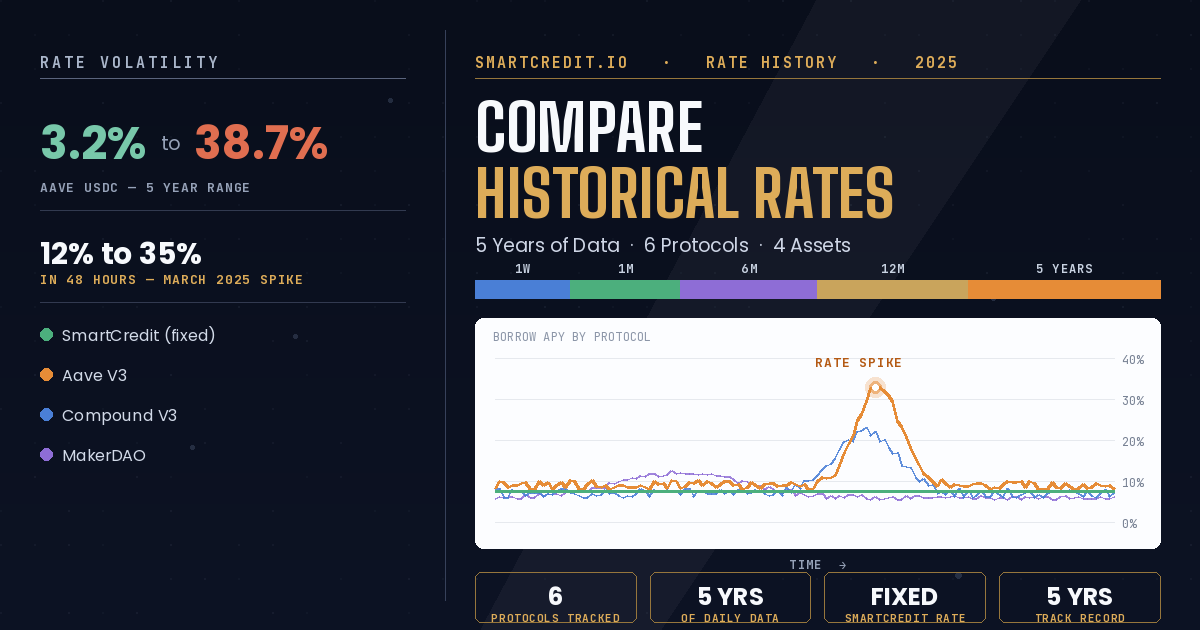
- Aave USDC rates have ranged from 3.2% to 38.7% over five years — the same “variable rate” label can mean fundamentally different borrowing terms.
- Rate spikes can be violent: Aave USDC moved from 12% to 35% in 48 hours in March 2025.
- SmartCredit’s peer-to-peer model locks the rate at loan origination — it does not change for the life of the term, in either direction.
- No wallet connection is required to view the historical charts.
What Variable Rates Actually Do
Before looking at the tool, it helps to understand the mechanics that make historical data valuable.
Variable rates in DeFi are algorithmically determined by pool utilization — the proportion of deposited assets currently lent out. When utilization rises, rates rise to attract new depositors and discourage additional borrowing. When utilization falls, rates drop. The algorithm responds in real time, which means rates can move dramatically within hours.
| Protocol | How the Rate Is Set | What This Means for a Borrower |
|---|---|---|
| Aave V2/V3 | Tied directly to utilization, no protection for open positions | A position costing 5% can cost 30% within 48 hours if demand surges |
| Compound V2/V3 | Similar utilization-based model | DAI rates have shown some of the highest intraday and intra-week swings tracked |
| MakerDAO | Stability fees set by governance vote | Financing cost can change due to a token-holder vote, unrelated to market conditions |
| SmartCredit.io | Peer-to-peer matching, locked at origination | A 90-day loan opened at 7.5% costs 7.5% — regardless of what Aave or Compound do while it’s open |
Understanding these mechanics changes how you interpret rate charts. A spike on Aave is not noise — it is what happens when utilization hits the kink in the curve and the protocol forcefully re-prices. That spike was real cost for anyone holding a variable-rate position at the time.
Lock the Rate Before It Moves
A SmartCredit fixed-rate loan costs exactly what it says at origination — for the entire term, no matter what happens on Aave or Compound.
Get a Fixed-Rate Loan →Five Years of Data: What the History Shows
SmartCredit.io analyzed five years of daily borrowing rate data across the major protocols tracked in the tool. A few findings stand out:
- Aave USDC rates ranged from 3.2% to 38.7% over five years — a swing of more than 1,100% between the lowest and highest rate in the dataset. A borrower entering at 3.2% and one entering at 38.7% are borrowing on fundamentally different terms, even though both positions are labeled “variable rate Aave USDC.”
- Rate spikes can be extremely rapid. In March 2025, Aave USDC rates moved from 12% to 35% within 48 hours. A borrower who entered at 12% expecting a stable cost faced nearly three times their anticipated rate by the end of the week.
- SmartCredit fixed rates show zero in-term volatility. A five-year chart of SmartCredit fixed rates shows discrete rate levels — each reflecting the yield curve at the time of loan origination — rather than the continuous spike-and-crash pattern visible on variable-rate protocols.
These are not edge cases. They are the normal operating history of variable-rate DeFi lending, visible only when you look beyond the current rate.
Why Rate Spikes Cluster Around Market Cycles
Rate spikes are not randomly distributed across time. They tend to cluster around the same conditions that drive crypto prices higher: rising collateral values encourage more borrowing against that collateral, growing total value locked pulls more capital into lending pools that then gets deployed, and rising confidence pushes more traders toward leveraged positions that require borrowed stablecoins. Aggregate market data — tracked publicly by services like DeFiLlama — shows total value locked and borrowing activity across DeFi rising and falling together across cycles, which is exactly the dynamic that pushes utilization, and therefore variable rates, toward their historical highs at the same moments borrowers are most inclined to take on new debt.
This creates a structural mismatch: the periods when a borrower is most likely to open a new variable-rate position are disproportionately the same periods when that position is most likely to get expensive. A borrower who only checks the current rate at the moment they need capital has no way to see this pattern. A borrower who checks the 5-year chart can see it immediately — the spikes visibly cluster around the same windows repeatedly, rather than appearing at random points throughout the history.
None of this means variable rates are always a mistake during active markets. It means the decision should be made with the historical pattern in view, not in ignorance of it.
A Worked Example: The Cost of That March 2025 Spike
Consider a borrower who opened a $50,000 USDC loan on Aave right at the start of that window, expecting a 90-day position at the prevailing 12% rate. Using the actual movement described above — a jump to 35% within 48 hours, holding near that level for roughly a month before easing back toward 18% — the real cost of the position looks like this:
| Period | Rate | Duration | Interest Accrued |
|---|---|---|---|
| Before the spike | 12% | 2 days | ~$33 |
| Spike period | 35% | 30 days | ~$1,438 |
| Partial reversion | 18% | 58 days | ~$1,430 |
| Total (90 days, variable) | — | 90 days | ~$2,901 |
| SmartCredit fixed at 9% (same 90 days) | 9% | 90 days | ~$1,110 |
This is an illustrative scenario built on the real rate movement SmartCredit’s data documented, not a specific historical loan — actual figures will vary with position size, timing, and the exact path a rate takes. But the pattern it demonstrates is real and recurring: the variable position started at a headline rate 3 points below the fixed alternative and still ended up costing roughly $1,790 more over the same 90 days once the spike is included. A rate that looks cheaper on day one is not the same as a rate that stays cheap.
How the Tool Works
Compare Historical Rates is available at smartcredit.io/interest-rates. No wallet connection is required.
Supported protocols: SmartCredit.io, Aave V2, Aave V3, Compound V2, Compound V3, MakerDAO.
Supported assets: ETH, DAI, USDC, USDT.
Available timeframes: 1 week, 1 month, 6 months, 12 months, 5 years.
Select the asset you’re borrowing, choose the time window, and the chart renders all protocols on the same axes. Each protocol appears as a separate line. The X-axis shows date; the Y-axis shows the borrowing rate as an APY percentage.
The multi-line layout is what makes the comparison useful. Looking at Aave V3 USDC in isolation over 12 months tells you how Aave has moved. Viewing it alongside Compound V3 and SmartCredit over the same window shows you how those movements relate — whether the spikes are protocol-specific or market-wide, and where fixed-rate costs have sat relative to variable-rate averages.
Rate Volatility Cuts Both Ways
The same swings that hurt variable-rate borrowers also make earned yield unpredictable for suppliers on those protocols. SmartCredit’s fixed-rate matching gives lenders a locked APY too.
See Fixed Lending Rates →Reading the Chart: What to Look For
Rate level relative to history. Before entering a variable-rate position, set the timeframe to 12 months or longer. Note where the current rate sits relative to the range. If the current rate is in the top quartile of the historical range, you are entering at an expensive point for prevailing conditions. If it is in the bottom quartile, conditions are relatively cheap.
Spike frequency and severity. On shorter timeframes (1 month, 6 months), count how many significant spikes occurred and how large they were. A protocol that has spiked three times in six months, each by 15 or more percentage points, is a different risk proposition from one that has moved within a 3-point band over the same period. This is not visible from the current rate alone.
Fixed vs variable spread. The gap between SmartCredit fixed rates and variable protocol rates narrows and widens over time. When variable rates are low, the fixed-rate premium may look large. During spikes, fixed rates often look inexpensive in hindsight. The 5-year chart makes these cycles visible.
Protocol divergence. When Aave and Compound rates diverge significantly, it usually reflects different pool compositions or liquidity conditions. Understanding which protocol tends to spike more sharply — and why — helps borrowers who have optionality between platforms. A protocol with a lower “optimal utilization” kink point, for instance, will start re-pricing sharply at a lower overall usage level than one with a higher kink, even if both protocols show similar current rates on a given day.
Fixed vs Variable: When Each Makes Sense
Variable rates are not always the wrong choice. Two use cases where they are appropriate:
- Flash loans and ultra-short positions (hours to days): rate volatility across a few hours is usually negligible relative to the arbitrage or farming spread being captured. The variable rate is a cost of execution, not a long-term burden.
- Professional arbitrageurs with real-time monitoring: automated systems that can close positions instantly when rates spike may be able to use variable rates effectively. Most retail borrowers do not have these tools.
For most other borrowing contexts, fixed rates are the more appropriate choice:
- Fixed-term business financing: a predictable cost of capital is a prerequisite for calculating whether a project is profitable. A financing cost that can triple within 48 hours is incompatible with most business planning horizons.
- Leveraged yield strategies: using borrowed capital to farm yield only works if the borrowing cost stays below the yield. A variable rate that spikes above the farming yield mid-position converts a profit strategy into a loss. Fixed-rate financing eliminates this risk for the loan term.
- Multi-week or multi-month positions: anyone holding a position across a significant time horizon is exposed to whatever rate environment develops during that period. Locking in the rate at entry isolates the position from subsequent market conditions.
The core structural problem with variable rates is timing: borrowing demand — and therefore rates — tends to be highest during bull markets and periods of peak activity, per the utilization mechanics common to floating-rate instruments generally. These are precisely the moments when borrowers are most active, most optimistic, and least focused on monitoring financing costs. The historical data in the tool shows this pattern across multiple market cycles.
Running a Leveraged Yield Strategy?
A borrowing cost that can spike above your farming yield turns a profit into a loss. Fix your financing cost for the term and remove that risk entirely.
Lock In Your Rate →Using the Tool in Practice
A practical workflow before opening a DeFi loan:
- Set the timeframe to 12 months and look at the protocol you are considering. Note the current rate, the 12-month low, and the 12-month high.
- Check if the current rate is near a spike peak. If it recently jumped from a much lower level, there is a reasonable chance it will revert — and also a risk that it stays elevated or goes higher.
- Compare to SmartCredit fixed rates for the same asset. If the variable rate is currently near historical lows and the fixed-rate premium is large, the variable option may look attractive. If variable rates have been volatile and the fixed premium is modest, the certainty of a locked rate often justifies the cost.
- Set a personal benchmark. After spending a few minutes with the 5-year chart, you will have a concrete sense of what “normal,” “cheap,” and “expensive” look like for that asset and protocol. Apply that benchmark to your decision rather than treating the current number as the only reference point.
The same workflow runs in reverse for anyone deploying capital as a lender rather than a borrower: a supplier choosing between parking stablecoins on a utilization-based pool or matching into a fixed-rate SmartCredit loan can use the identical charts to see which option has actually paid more consistently, rather than chasing whichever pool’s utilization happens to be elevated this week.
Getting Started
Compare Historical Rates is available at smartcredit.io. No wallet connection or account is required — open the tool, select an asset, and the historical data loads immediately, which makes it worth checking even for a loan you’re only considering rather than ready to open today.
Start with the 12-month view on the asset you are most likely to borrow. Switch to 5 years to see full market cycles, paying particular attention to how many times the rate has spiked and how quickly it reverted afterward. Then compare across protocols to understand where variability is highest and where it is most contained — some assets and protocols are consistently calmer than others, and that difference only becomes visible once you’re looking at more than a single day’s number.
The data is there. The only thing that changes is whether you look at it before borrowing or after.
Frequently Asked Questions
What is Compare Historical Rates?
Compare Historical Rates is a free tool on SmartCredit.io that charts DeFi borrowing rates across six protocols — SmartCredit.io, Aave V2, Aave V3, Compound V2, Compound V3, and MakerDAO — over timeframes from one week to five years, for ETH, DAI, USDC, and USDT.
Why do DeFi rates change so quickly?
Most major protocols price loans algorithmically based on pool utilization — the share of deposited assets currently borrowed. As utilization rises toward a protocol’s target threshold, the rate curve steepens sharply, which is why rates can move from single digits to 30%+ within days during periods of high borrowing demand.
How is SmartCredit’s rate different from Aave or Compound?
SmartCredit uses peer-to-peer matching, which locks the rate at the moment a loan originates. A 90-day loan opened at 7.5% costs 7.5% for the full term, regardless of what happens to utilization-based rates elsewhere. Borrowing on SmartCredit removes the risk of a mid-term rate spike entirely.
Is a fixed rate always better than a variable one?
No. Variable rates can make sense for very short positions — flash loans or trades lasting hours to days — where the arbitrage or farming spread comfortably exceeds any plausible rate movement in that window, or for professional operators with automated monitoring that can exit instantly. For most multi-week or multi-month positions, the certainty of a fixed rate is usually worth more than the chance of a marginally lower variable one.
What is the largest rate swing the tool has recorded?
Aave USDC rates have ranged from 3.2% to 38.7% over the five-year dataset — more than an 1,100% difference between the low and high. Separately, Aave USDC moved from 12% to 35% within 48 hours in March 2025, illustrating how fast a spike can develop within a single week.
In practice: if the 12-month chart shows a protocol has spiked repeatedly, that’s a signal to check what a fixed-rate SmartCredit loan would cost for the same term before committing to a variable position.
Does MakerDAO’s stability fee work the same way as Aave’s rate?
No. MakerDAO’s stability fee is set by a governance vote among MKR/SKY token holders rather than an automatic utilization formula. This means a borrower’s financing cost can change because of a governance decision unrelated to market conditions — a different kind of risk from the algorithmic volatility seen on Aave or Compound.
Do I need a wallet connected to view the historical charts?
No. The charts load without connecting a wallet or creating an account. A wallet or account is only needed if you act on what you see — for example, opening a loan or lending position.
How often is the historical data updated?
The tool tracks daily rate data across all six supported protocols, so shorter timeframes (1 week, 1 month) reflect very recent movements, while the 5-year view captures full market cycles including past spikes and quiet periods.
Can I use the tool if I’m lending rather than borrowing?
Yes. The same rate history that helps a borrower judge whether a rate is high or low also helps a lender see which protocols have paid suppliers more consistently over time, rather than chasing whichever pool has the highest rate today.
What should I do if I’m already in a variable-rate position and rates spike?
The options are limited once a variable position is open: repay early if you have the capital available, wait out the spike if your position can tolerate the higher cost, or refinance into a fixed-rate loan to stop further exposure to additional spikes for the remainder of your intended holding period. Checking the historical chart at that point won’t undo the cost already accrued, but it will tell you whether the current level is likely to persist or is already unusually high relative to the protocol’s own history — useful context for deciding whether to wait it out or exit.
Stop Guessing Whether a Rate Is High or Low
See five years of DeFi rate history, then lock a fixed rate — as a borrower or a lender — on SmartCredit.
Compare Historical Rates →