Table of Contents
show
The plan for 4.11.2024–4.11.2025
Planned Statistics:
- Circulating tokens at 4.11.2024–2,409,072
- Circulating tokens on 4.11.2025–2,810,584
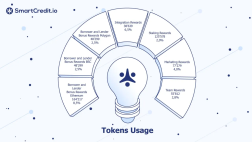
Planned Usage:
- Bonus Rewards for the Borrowers and Lenders on Ethereum — 4’401 tokens per week, 228,862 tokens per year, 9.5% inflation
- Staking rewards for the Holders — 2’316 tokens per week, 120,454 tokens per year, 5.00% inflation
- Marketing tokens — 12,045 tokens annually, 0.50% inflation
- Team tokens — 40,151 tokens, 10% of the annualized inflation, to be allocated at 4.11.2025
- Inflation per year — 16.67%
Token usage 4.11.2023–4.11.2024
Summary:
- Circulating tokens on 4.11.2023–2,063,936
- Circulating tokens on 4.11.2024–2,409,072
Statistics:
- Bonus Rewards for the Borrowers and Lenders on Ethereum — 3’771 tokens per week, 196,074 tokens per year, 9.50% inflation
- Staking rewards for the Holders — 2’004 tokens per week, 104,229 tokens per year, 5.05% inflation
- Marketing tokens — 10,320 tokens annually, 0.50% inflation
- Team tokens — 34,514 tokens, 10% of the annualized inflation, to be allocated at 4.11.2024
- Inflation per year — 16.72%
Initially, planned inflation was 17.83% per year. As we used fewer marketing tokens, this resulted in 16.72% annual inflation.
Changes to the previous epoch:
Here are the key differences to the last period:
- We reduced the staking rewards a bit; however, if we calculate that 50% of the circulating supply is staked, the real return for the stakers is more than 10%.
- We increased the borrower/lender bonus rewards to facilitate platform usage.
- And we reduced the marketing budget.
The planned inflation for the new period is 16.72%. We work on keeping the real inflation lower than the planned one.


